
So, when it comes to Sentry, we know it's used to track errors primarily and to monitor the performance and metrics of our apps on the internet.
But when it comes to integration, Sentry offers multiple SDKs for different languages and frameworks. For developers looking to integrate Sentry with Next.js, you're in the right place.
Some weeks back, I integrated Sentry with my portfolio website (where you're reading this blog). While there are numerous options available for integration, understanding the basics and choosing the right option based on our needs is crucial.
Installation and Setup
First things first, we need a Next.js project and Sentry installed in it
You can create a new Next.js application by following the official documentation here.
For Sentry integration, follow the steps mentioned here, or you can also opt for manual setup by following this guide.
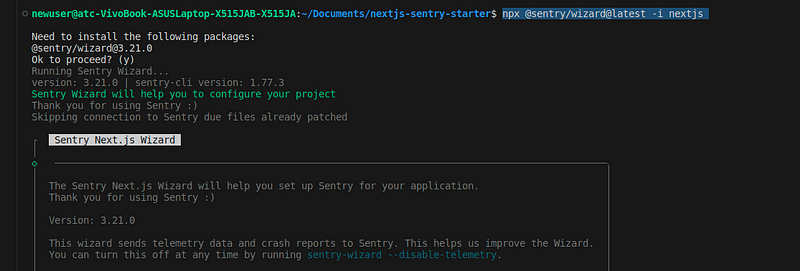
Here's what I did while installing Sentry with the wizard
Start installing with the wizard using the command:
npx @sentry/wizard@latest -i nextjs
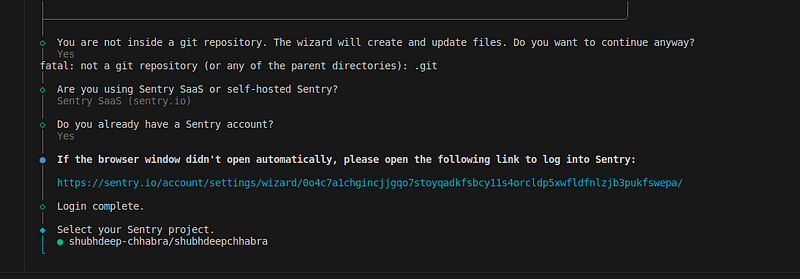
Ensure you have already created an ID in Sentry. After choosing Sentry SaaS and authenticating, you can select the appropriate project.
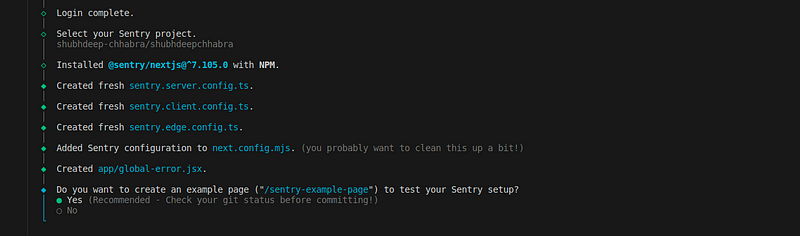
Once Sentry is installed, let's create an example page to test it out and complete the installation and setup.
Understanding Configuration Files
sentry.client.config.ts
This file is used to track issues and events from the client side (frontend). Here's a breakdown of the options:
- dsn: Defines your project on Sentry SaaS.
- debug: Enables logs from the Sentry SDK.
- tracesSampleRate: Determines the rate at which Sentry tracks events and creates traces.
- replaysOnErrorSampleRate: Rate at which replays (screen recordings) are created for errors.
- replaysSessionSampleRate: Rate at which every user session is tracked and replays are formed.
- integrations: Array where Sentry integrations and custom integrations are added.
// This file configures the initialization of Sentry on the client.
// The config you add here will be used whenever a users loads a page in their browser.
// https://docs.sentry.io/platforms/javascript/guides/nextjs/

import * as Sentry from '@sentry/nextjs';

Sentry.init({
	dsn: 'https://78d54274aa18a551e149fb0f3d95@o4506194538240.ingest.us.sentry.io/45064180480',

	// Adjust this value in production, or use tracesSampler for greater control
	tracesSampleRate: 1,

	// Setting this option to true will print useful information to the console while you're setting up Sentry.
	debug: false,

	replaysOnErrorSampleRate: 1.0,

	// This sets the sample rate to be 10%. You may want this to be 100% while
	// in development and sample at a lower rate in production
	replaysSessionSampleRate: 0.1,

	// You can remove this option if you're not planning to use the Sentry Session Replay feature:
	integrations: [
		Sentry.replayIntegration({
			// Additional Replay configuration goes in here, for example:
			maskAllText: true,
			blockAllMedia: true,
		}),
	],
});
sentry.server.config.ts
This file is used to track issues and events from the server side of the project.
// This file configures the initialization of Sentry on the server.
// The config you add here will be used whenever the server handles a request.
// https://docs.sentry.io/platforms/javascript/guides/nextjs/

import * as Sentry from '@sentry/nextjs';

Sentry.init({
	dsn: 'https://78d54274aa18a551e149fb0f3d95@o4506194538240.ingest.us.sentry.io/45064180480',

	// Adjust this value in production, or use tracesSampler for greater control
	tracesSampleRate: 1,

	// Setting this option to true will print useful information to the console while you're setting up Sentry.
	debug: false,

	// uncomment the line below to enable Spotlight (https://spotlightjs.com)
	// spotlight: process.env.NODE_ENV === 'development',
});
sentry.edge.config.ts
This file is used to track events and issues from edge runtime like in edge routes and middleware.
// This file configures the initialization of Sentry for edge features (middleware, edge routes, and so on).
// The config you add here will be used whenever one of the edge features is loaded.
// Note that this config is unrelated to the Vercel Edge Runtime and is also required when running locally.
// https://docs.sentry.io/platforms/javascript/guides/nextjs/

import * as Sentry from '@sentry/nextjs';

Sentry.init({
	dsn: 'https://78d54274aa18a551e149fb0f3d95@o4506194538240.ingest.us.sentry.io/45064180480',

	// Adjust this value in production, or use tracesSampler for greater control
	tracesSampleRate: 1,

	// Setting this option to true will print useful information to the console while you're setting up Sentry.
	debug: false,
});
In your next.config.mjs, configure Sentry options according to your requirements.
export default withSentryConfig(
	nextConfig,
	{
		// For all available options, see:
		// https://github.com/getsentry/sentry-webpack-plugin#options

		// Suppresses source map uploading logs during build
		silent: true,
		org: 'shubhdeep-chhabra',
		project: 'shubhdeepchhabra',
	},
	{
		// For all available options, see:
		// https://docs.sentry.io/platforms/javascript/guides/nextjs/manual-setup/

		// Upload a larger set of source maps for prettier stack traces (increases build time)
		widenClientFileUpload: true,

		// Transpiles SDK to be compatible with IE11 (increases bundle size)
		transpileClientSDK: true,

		// Routes browser requests to Sentry through a Next.js rewrite to circumvent ad-blockers. (increases server load)
		// Note: Check that the configured route will not match with your Next.js middleware, otherwise reporting of client-
		// side errors will fail.
		tunnelRoute: '/monitoring',

		// Hides source maps from generated client bundles
		hideSourceMaps: true,

		// Automatically tree-shake Sentry logger statements to reduce bundle size
		disableLogger: true,

		// Enables automatic instrumentation of Vercel Cron Monitors.
		// See the following for more information:
		// https://docs.sentry.io/product/crons/
		// https://vercel.com/docs/cron-jobs
		automaticVercelMonitors: true,
	}
);
in /app, there will be a sentry-example-api and sentry-example-page added to display an example of how the sentry tracks errors and events both from the client and server side.
Portfolio Configuration
What I did in my portfolio
I'm using PostgreSQL with Prisma for storing some data like views and reactions, while other data like blog MDX files are stored on the client side.
Here's how I configured Sentry in my portfolio:
// sentry.client.config.ts
import * as Sentry from '@sentry/nextjs';

Sentry.init({
	dsn: process.env.NEXT_PUBLIC_SENTRY_DSN || process.env.SENTRY_DSN, // To store dsn value in env variables and it is stored in 2 variables as on client side Nextjs needs env with prefix NEXT_PUBLIC

	tracesSampleRate: 1, // To trace every event in production.

	debug: process.env.NODE_ENV === 'development', // To have logs but in development environments.

	replaysOnErrorSampleRate: 1.0, // To trace every session with error.

	replaysSessionSampleRate: 0.1, // To trace 10% of sessions(without any error).

	integrations: [
		// Sentry repaly integration configs to mask all text and block media in replays captured.
		Sentry.replayIntegration({
			maskAllText: true,
			blockAllMedia: true,
		}),
	],
});

// sentry.server.config.ts
import * as Sentry from '@sentry/nextjs';
import { prisma } from './utils/prisma';

Sentry.init({
	dsn: process.env.NEXT_PUBLIC_SENTRY_DSN || process.env.SENTRY_DSN, // same reason mentioned in client config.

	tracesSampleRate: 1, // same reason to track every event in server side.

	debug: process.env.NODE_ENV === 'development', // logs only for development env.

	integrations: [new Sentry.Integrations.Prisma({ client: prisma })], // Added integration for prisma to track every db query done by prisma.
});

// sentry.edge.config.ts
// This was optional for my case, as i am not using edge middlewares or edge runtime but i diddnt removed this for later purpose
import * as Sentry from '@sentry/nextjs';

Sentry.init({
	dsn: process.env.NEXT_PUBLIC_SENTRY_DSN || process.env.SENTRY_DSN,

	tracesSampleRate: 1,

	debug: process.env.NODE_ENV === 'development',
});
By running this, Sentry can track every error and different types of events like pageloads, navigations, and database queries.
Conclusion
Sentry provides various options to configure and customize error tracking and performance monitoring according to your project needs. Explore the options supported by @sentry/nextjs here.
Bonus Tip
In sentry.server.config.ts, there's an option mentioned in the comments by the wizard:
// uncomment the line below to enable Spotlight (https://spotlightjs.com)
// spotlight: process.env.NODE_ENV === 'development',
Spotlight allows tracking events, errors, and other metrics locally. It doesn't require sending data to the Sentry server for debugging purposes, making development easier.
We'll dive deeper into this in the next blog. Stay tuned!
If you are reading this blog till here then do follow me on X — @okshubhh
bye