
Yeah, you read it right. Sentry for localhost!😅
Developers can now track the errors and traces while developing the apps which will help in debugging.
But, how can we trace everything locally, wouldn't that be too much?
No, it's very simple and a 2 step process.
Although we have very well-explained docs for Spotlight. But, let's understand it with a nextjs app example (my portfolio, where you are reading this article.)
As I said above, Spotlight works in 2 steps:
- Setting up and initiating the Spotlight in the development environment of the app.
- Creating a server that will receive all data from your app which will be sent to Sentry servers with the help of SDKs. The name of that server is - Sidecar
Also, you know that you don't need a DSN while working with Spotlight.
Making it completely free 🥳🤑
BTW, Spotlight Docs are here - Spotlight
Ok let's start with the example, I'm skipping the step where I configured Sentry with my portfolio. If you wanna see that, you can refer to this blog
Setting up Spotlight
Since it is just for local and needed only while developing, I added it as a dev dependency
npm i @spotlightjs/spotlight --save-dev
Now in sentry.client.config.(js/ts)
I imported Spotlight like this
import * as Spotlight from '@spotlightjs/spotlight';
And, initiated Spotlight at the end, after initiating Sentry [SUPER IMPORTANT]
if (process.env.NODE_ENV === 'development') {
	Spotlight.init({
		debug: true, //this will help in better debugging by logging the console logs in devtools.
	});
}
This will initiate the Spotlight in our next.js app but, how will the app or to be precise the SDKs know that Spotlight is added to the app and the data should also be sent to Spotlight?
The answer for that is that Spotlight gets the data directly from client-side SDKs but when it comes to the server-side SDKs we need to pass a config while initiating Sentry.
So for sentry.server.config.(js/ts)
we have to pass a boolean in config like this
import * as Sentry from '@sentry/nextjs';
import { prisma } from './utils/prisma';

Sentry.init({
	dsn: process.env.NEXT_PUBLIC_SENTRY_DSN || process.env.SENTRY_DSN, // same reason mentioned in client config.

	tracesSampleRate: 1, // same reason to track every event in server side.

	debug: false, // logs only for development env.

	integrations: [new Sentry.Integrations.Prisma({ client: prisma })], // Added integration for prisma to track every db query done by prisma.

	spotlight: process.env.NODE_ENV === 'development', // Sentry will send the event evelopes from server side to spotlight.
});
Setting up the Sidecar
Now, the Spotlight is set and initiated and the last important step is the Sidecar which is a server running on the same device where Spotlight is set and initiated.
it is a server that uses the SSE(Server Sent Events) approach. more about it here.
The simplest way to run it is by modifying scripts in package.json to this -
"dev": "concurrently \"npm run setup-sidecar\" \"next dev\"",
"setup-sidecar": "npx @spotlightjs/spotlight",
npx @spotlightjs/spotlight will create and run the sidecar on localhost port 8969 by default(so keep the port empty for our hero😆).
Running the Spotlight
Now we are ready and when we run the app locally, npm run dev
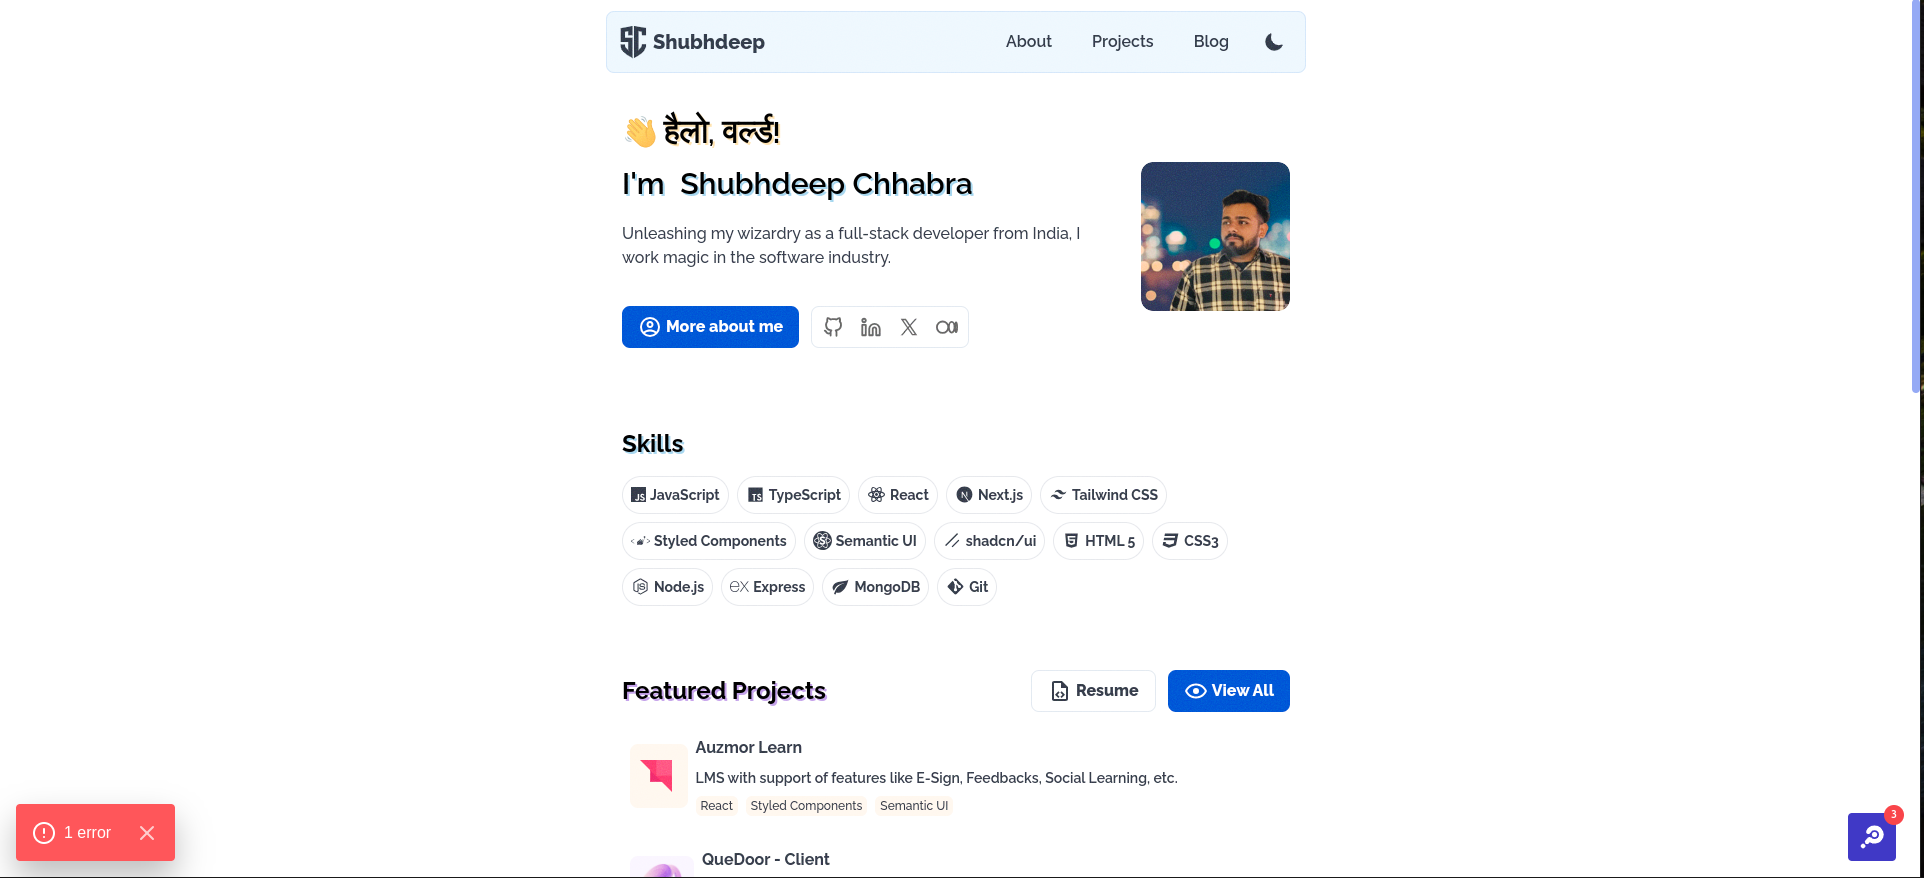
we will get to see a trigger button on the bottom-right of our app. Also, The "More about me" button in my portfolio is broken by change and it not redirecting. On Clicking the button, the errors is also tracked by Spotlight
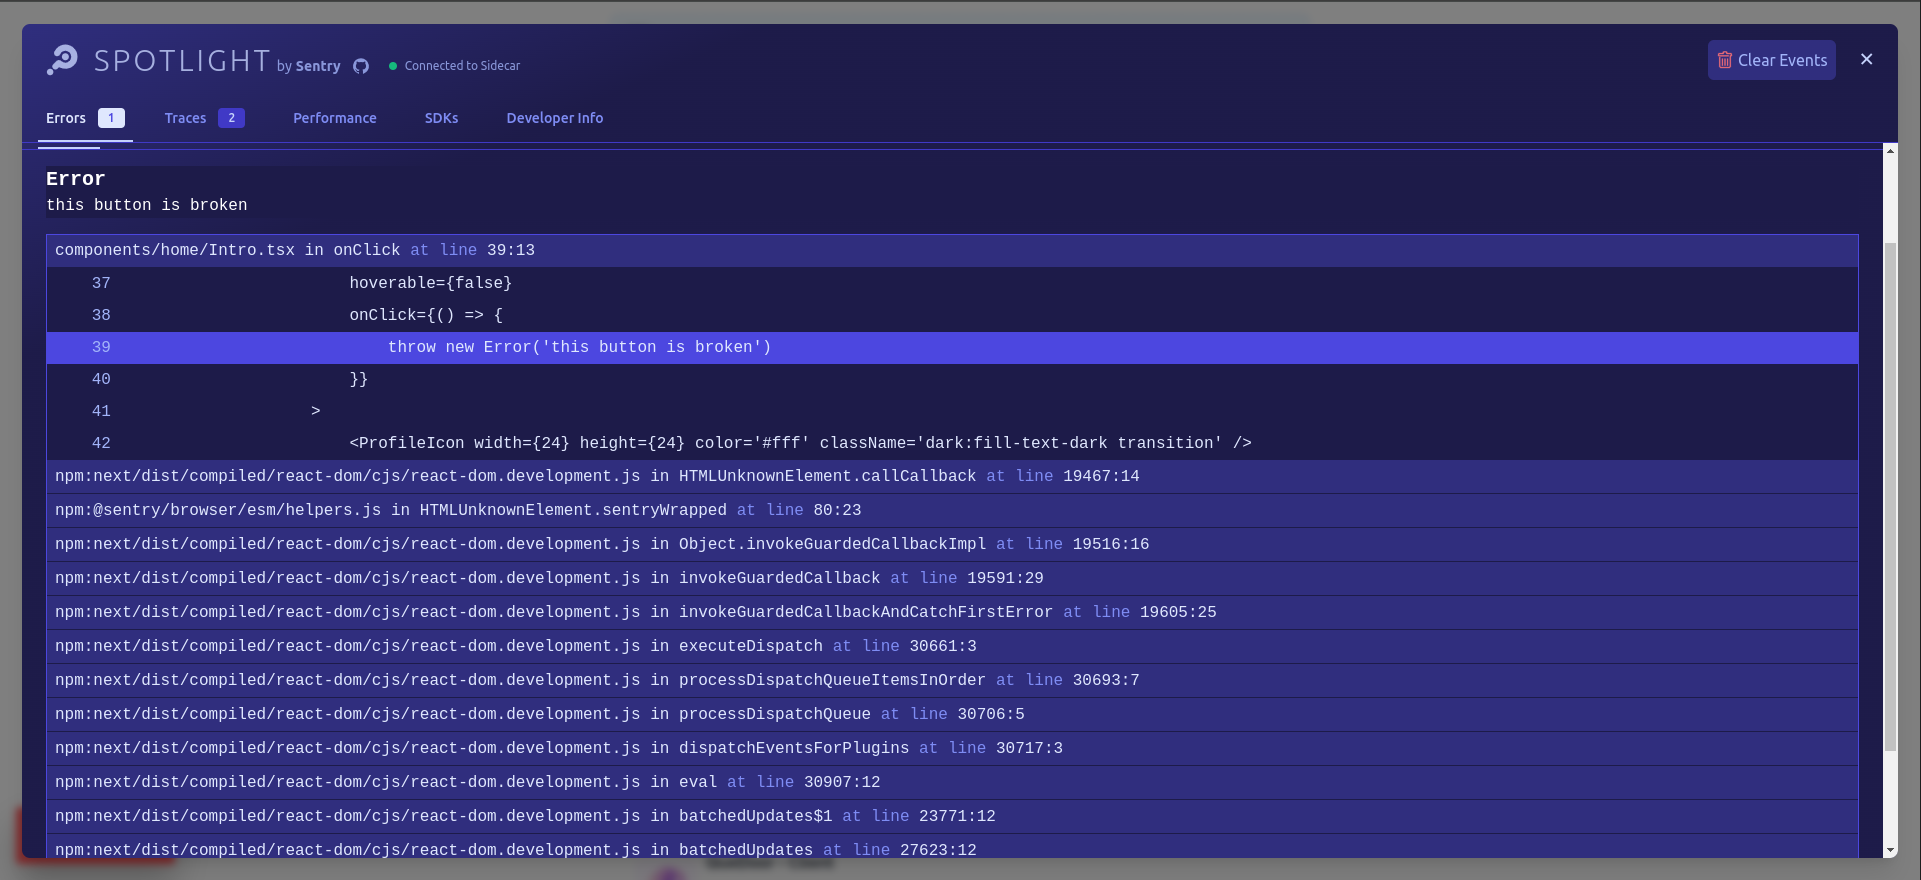
On clicking the Button we will get the view of Spotlight Overlay which is the UI for the Spotlight added as the overlay in your app.
Where we will have different tabs to see the data stored by the Sidecar.
In the Errors tab, on clicking a specific error we will get the complete stack trace attached and it covers both client and server-side stack traces when an error is linked between them.
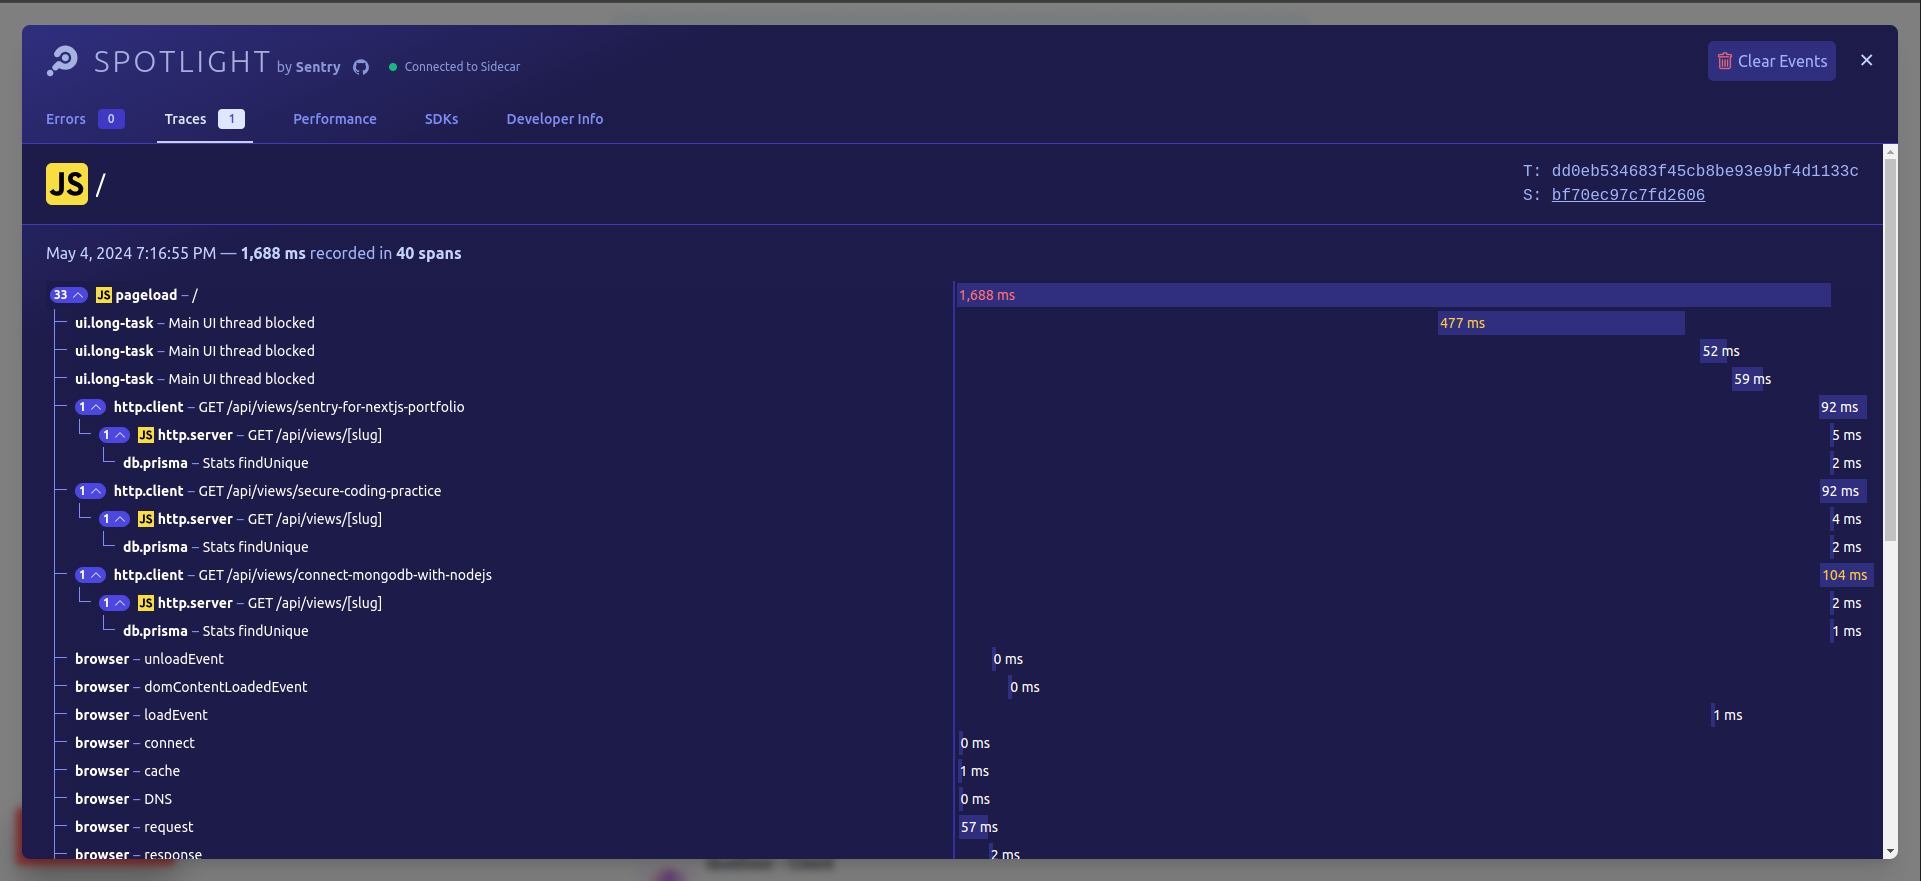
The traces tab also lists all traces tracked by the Sentry and each trace looks like this and contains complete info about the resources loads on the client side and the APIs and DB queries hit on the server side. Similar to what we see on the Sentry dashboard.
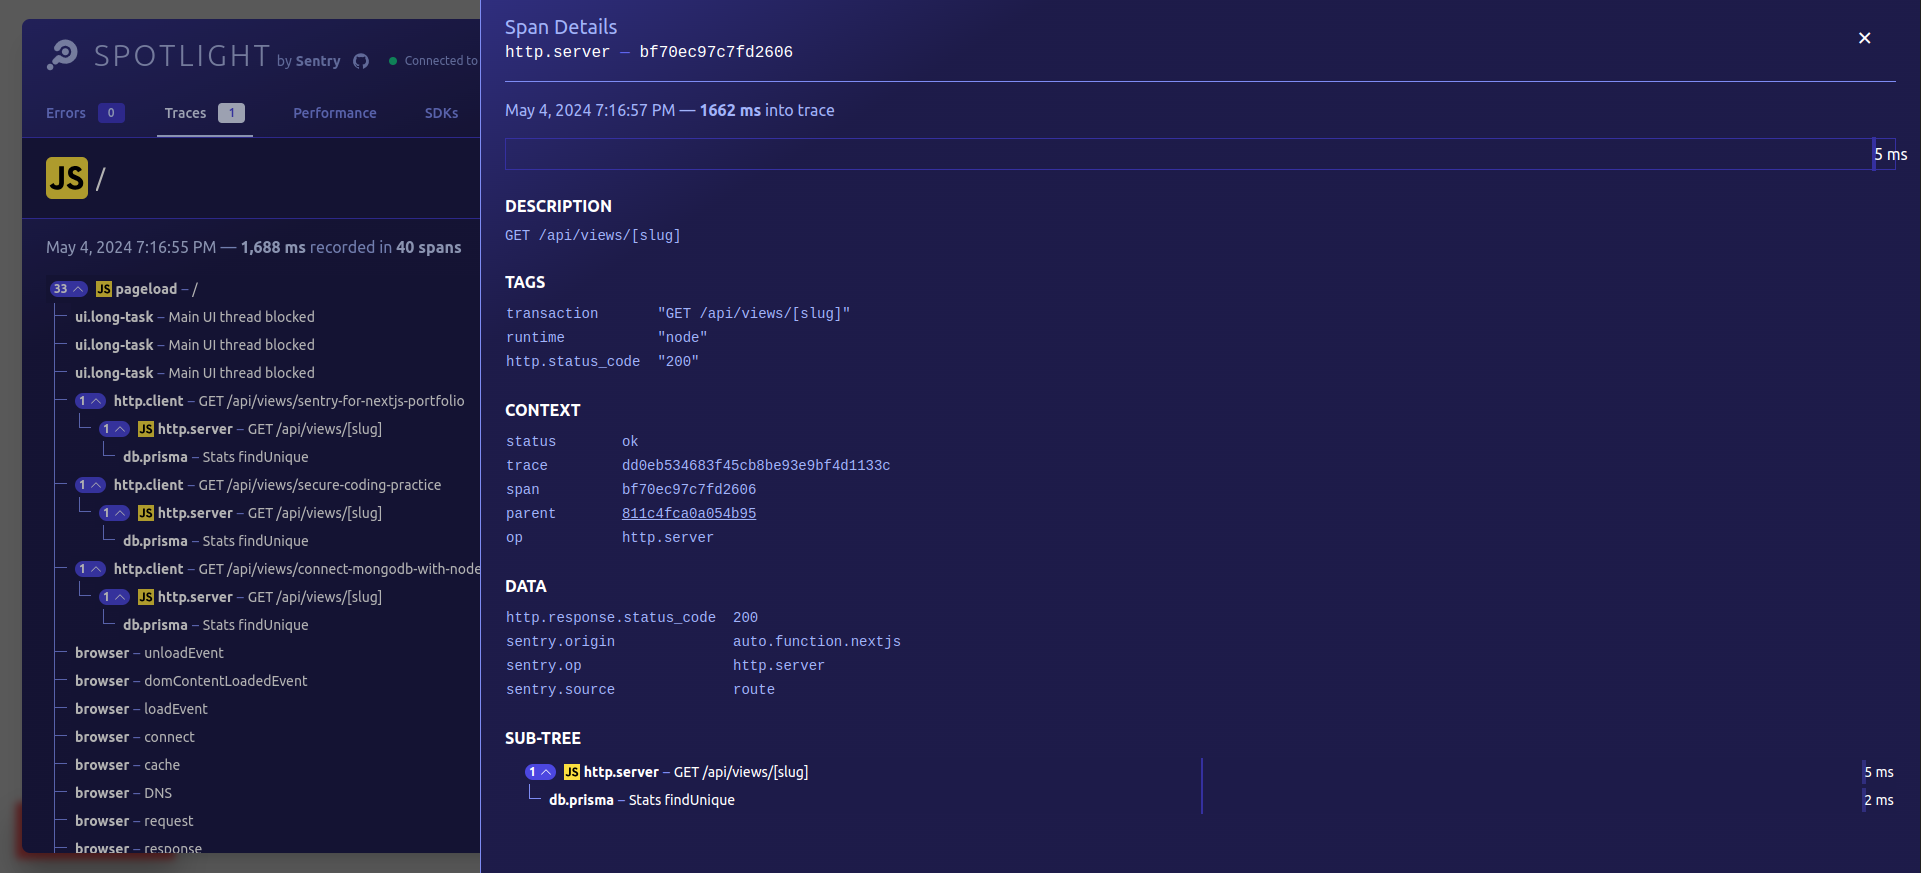
We can also view the detail of each span in the traces by clicking them
There are other more information which Spotlight provides which are:
- Performance tab - here we can check all queries and resources present in all tracked traces. And WebVitals of our app.
- SDK tab - we will get the info about the SDKs we are using with Spotlight.
- Developer Info - This is used by the Sentry SDK developing team mostly, here we will get the list of raw events received by the Spotlight from Sentry SDK. Giving much deeper info for debugging.
Right now Spotlight is supported by almost all of the Sentry SDKs.
And yeah, that's the end of our blog today.
If you are reading this blog till here then do follow me on X — @okshubhh
bye